 |
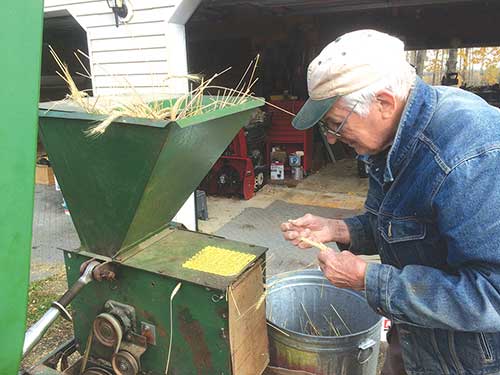
| Ben Hoffman threshing wheat. Photo courtesy of Jonathan Hoffman |
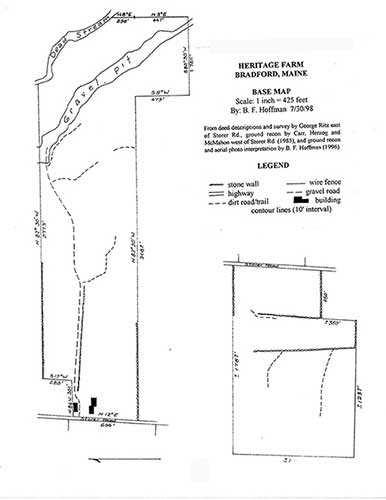 |
| Map 1 – Base map |
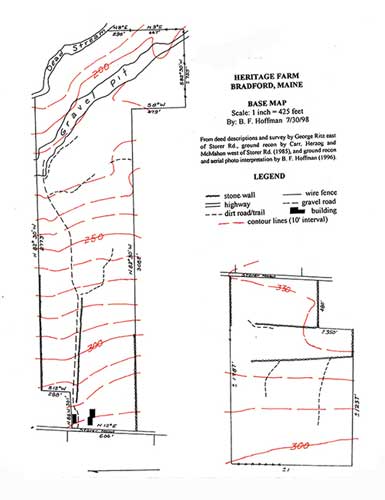 |
| Map 2 – Base map with contour lines |
|
| Map 3 – Map with soil types |
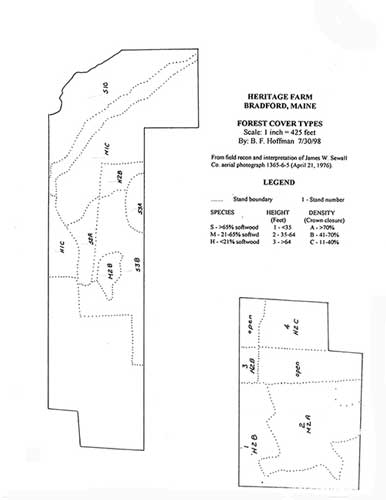 |
| Map 4 – Map with forest cover types |
By Ben Hoffman
Maps showing land boundaries and vegetation are among the most useful tools a landowner can have. The key map, a base map on which others can be based, is a property map showing metes and bounds (limits or boundaries of a tract of land as identified by natural landmarks), usually plotted from a deed description. Map 1 is an example. This map should also show permanent features such as buildings, roads, trails, streams, ponds, stone walls and fence lines, and indicate open and wooded land. Such maps are most useful when plotted at the same scale on an 8 1/2 x 11 sheet that is easily photocopied as needed for field use.
You can get fairly detailed maps, with field (and forestry) names, demarcations, etc., if you go to a local USDA Farm Service Agency (FSA) or USDA Natural Resources Conservation Service (NRCS) office and ask someone to come to your farm or homestead to use GIS to tag boundaries. Another mapping tool, farmOS (https://farmos.org/), is more farm-field oriented but may be applicable to the overall homestead.
Contour lines (Map 2) plotted from a U.S. Geological Survey map are simple additions to a base map. Contours help visualize drainage problems and slopes, and for agricultural use they help for planning strip cropping and terracing.
Soils maps (Map 3) are most useful for planning agricultural activities. Also, the USDA rates soils for their suitability for roads, trails and development. Forest cover is less affected by variations in soil structure, but differences in moisture and drainage affect species composition, growth and potential logging problems. Find soil maps at https://websoilsurvey.nrcs.usda.gov/app/ or, for mobile devices, use the iOS and Android SoilWeb app, version 2.0. Note, however, that soil descriptions may not be accurate or up to date.
Forest conditions (Map 4) are best shown by identifying and classifying stands within the forest, drawing in stand boundaries and labeling stands. Stereo aerial photos available at USDA NRCS and state forestry offices make this easy. Lacking aerial photos, you can use satellite imagery. This is the simplest classification system:
Species
S – softwood – 65% or more conifers
M – mixed wood – 21 to 64% softwood
H – hardwood – less than 21% softwood
Height
1 – less than 15 feet
2 – 15 to 64 feet
3 – over 64 feet
Density (crown closure)
A – 70%
B – 41 to 70%
C – 11 to 40%
Initially you can eyeball these classifications easily from photos and later verify them by inventory. If using satellite imagery, verify conditions with ground recon.
These four basic maps provide most of the information landowners need to manage their property.
About the author: Ben Hoffman farmed and managed his forest in Bradford, Maine. MOFGA was deeply saddened to learn of his passing in December 2019. We are grateful to his family for allowing us to print this article, which Ben had written earlier in 2019. Ben had a Ph.D. in forestry from Yale, worked in government and private industry, taught forest management and timber harvesting at the University of Maine and spent 11 years in British Columbia and Alaska as a volunteer teaching forest technology for Covenant Life College – and had many other interests and accomplishments. He leaves behind his wife of 67 years, Marjorie, of Bradford, and three grown children and their families.