By Rick Kersbergen, Tim Dalton and Lisa Bragg
Copyright ©2006 by the authors
The authors are extension professor, associate professor and research assistant, University of Maine, Orono. They wish to acknowledge the work of Robert Parsons, Glenn Rogers, Dennis Kauppila, and Qingbin Wang at the University of Vermont and Nat Bacon and Lisa McCrory of NOFA-Vt.
This research is based upon work supported by the Cooperative State Research, Education, and Extension Service, U.S. Department of Agriculture, under Agreement No. 2004-51300-02250, ‘Profitability and Transitional Analysis of Northeast Organic Dairy Farms,’ an Organic Initiative project. This research also received financial support from the Vermont Agricultural Experiment Station, University of Vermont Extension and the John Merck Fund
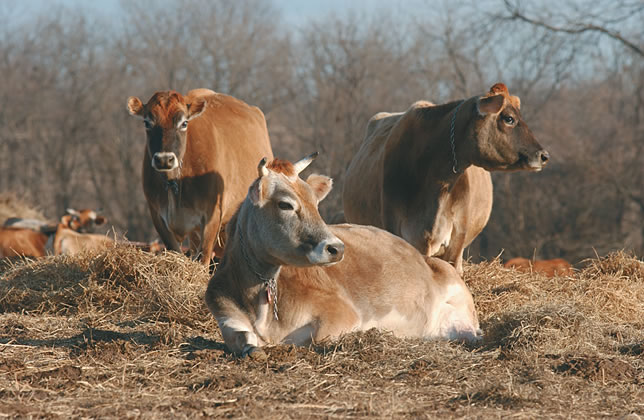 |
Organic dairy farming has become the fastest growing agricultural sector in New England. Maine has the highest percentage of organic dairy farms compared with conventional in the nation. This growth has occurred within the last 10 years, largely from farms switching from conventional to organic practices. A contributing factor was the mid- to late-1990s expansion of “Vermont Organic Cow” into a major purchaser and processor of organic milk.
Despite the growth, little information has been available on the cost of producing organic milk. In 2004, the University of Vermont and the University of Maine received funding from the USDA Integrated Organic program to conduct the research project, “Profitability and Transitional Analysis of Northeast Organic Dairy Farms.”
Defining an Average Farm
In the winter and spring of 2005, researchers collected production and financial information from 30 farms in Maine and Vermont. The pooled data allowed us to describe an “average” farm (Table 1) that milked 48 cows, sold 6,890 hundredweights of milk, and was paid an average of $22.97 per hundredweight, including all premiums. By contrast, similar sized nonorganic farms in Maine producing for conventional markets received an average milk price of $18.07 during 2004, $4.90 per hundredweight less than organic producers.
The average amount of milk sold per cow for this size farm was similar between organic and nonorganic producers (14,060 pounds for the organic sample versus 14,857 pounds for nonorganic). The requirement to feed calves organic whole milk for 60 days may account for a portion of this difference. Organic farms earned on average $158,075 from milk sales.
Purchased feed and hired labor are the two major expenses in organic milk production. Organic feeding practices were significantly more expensive than nonorganic practices. Overall, our average, 48-cow organic farm spent $49,416 for purchased feed during 2004–about $1,000 per cow or $7.24 per hundredweight.
This was $298 per cow and $2.66 per hundredweight more than nonorganic producers in Maine and $133 per cow and $2.62 per hundredweight more than Northeast Farm Credit averages for similarly sized herds. The additional expense of feeding organic dairy cows wipes out 54% of the higher price premium received for organic milk.
Most organic dairy farms rely on family labor. On average, 5,042 hours of family labor were used on organic farms, which is not significantly different from similar nonorganic farms. However, organic producers spent more money on hired labor, since laborers worked more hours and were paid slightly higher wages. Fifty seven percent hired some form of a part-time employee, working approximately 23 hours per week. This employee was paid an average of $14.51 an hour, including all taxes and benefits. Hired labor expense cost organic producers $320 per cow or $2.10 per hundredweight.
Income and Expenses
When we looked at farm profitability and returns to farm family resources, we found that the total cost (cash operating expenses plus depreciation) of producing organic milk is estimated at $22.58 per hundredweight. And remember, farms earned $22.97 per hundredweight of milk produced, on average. Simply put, organic milk production on the average for 2004 in Maine and Vermont did not generate any return to unpaid labor or management, nor did it generate sufficient net income to produce a positive return to farm assets or equity.
As a result, many organic dairy farms are largely supported by nondairy farming activities and withdrawals from farm equity. Forty-three percent of organic dairy farms generate some kind of off-farm income.
A Survey of Maine’s organic industry in 2003 found that more than 90% of farms transitioned for economic reasons, including a higher and more stable milk price, with hopes of larger profits. Many farmers feel that they did achieve good returns in the late ‘90s and early in this century. However, comparing the rate of return on assets for conventional producers in 2004 (4.1%) with that of organic dairy farms in the study (-2.9%) shows that most organic producers did not achieve the level of financial success they had hoped for. The average price of organic milk would have to have been 19% higher ($27.37 per hundredweight) to match the conventional 4.1% rate of return. Generating a 5% rate of return would have required an average price of $28.05 per hundredweight. It is important to note that one-third of the farms in the study were profitable. We are working with our data to characterize these farms in an attempt to correlate management practices with profitability.
What about 2005?
Since organic dairy farming in Maine and Vermont was not profitable, on average, in 2004, we projected farm profitability for 2005 given that prices for feed and fuel have risen during the past year. Since 2004, organic feed concentrate costs have increased between 5 to 10 percent. Concentrate feed costs make up 92% of the purchased feed bill and amount to $45,462 for our average organic farm. Fuel prices have also risen to levels higher than 2004, despite declining in late fall. Diesel prices are 27% higher in 2005 than they were in 2004, while gasoline is 17% higher.
Assuming even conservative estimates of a 10% increase in fuel price and a 7.5% rise in concentrated feed cost, the return to farm assets drops to -3.7 percent. The average milk price would need to be $25.59 per hundredweight for farmers to break even and to prevent farm equity withdrawals, just to remain in business. To generate a positive return on assets of 4.1%, milk prices would need to increase by nearly 24.1% to $28.50 per hundredweight. The milk price would need to be $29.11 per hundredweight for a 5% rate of return on assets.
The Good News… Opportunities Do Exist!
So what are the economic incentives to remain organic or to consider transitioning? For one thing, data from this survey are being used by producers to request higher milk prices from their processors. All three major organic milk markets have recently responded with significant jumps in contract prices in New England. Using 2004 figures, the new base pricing being offered to farmers will make most of them profitable and provide a positive return on assets.
Second, the market for organic milk is growing, despite the higher cost to consumers. In an effort to increase supply, processors are offering significant price and quality incentives as well as subsidization during the transition period, if farmers commit to their markets. Organic dairy farming may also provide opportunities for new, young producers, something that our industry, with its aging farm population, needs.
To achieve higher profits, organic farmers need to use available pasture systems efficiently and use quality forages to help reduce the amount of grain purchased. Demand for the product is here to stay, but processors must continue to help their producers remain profitable. That’s good business for everyone.
Table 1. What Organic Dairy Farms Look Like
| Average | Low | High | |
| Cows | 48 | 20 | 80 |
| Milk produced (cwt.) | 6,890 | 2,100 | 13,000 |
| Rolling herd average | 14,060 | 6,940 | 21,316 |
| Milk price ($/cwt.) | 22.97 | 19.88 | 27.04 |
| Milk revenue | 158,075 | 49,013 | 339,117 |
Table 2. Total Farm, Per Cow and Per Hundredweight Costs and Returns to Organic Dairy Farming in 2004
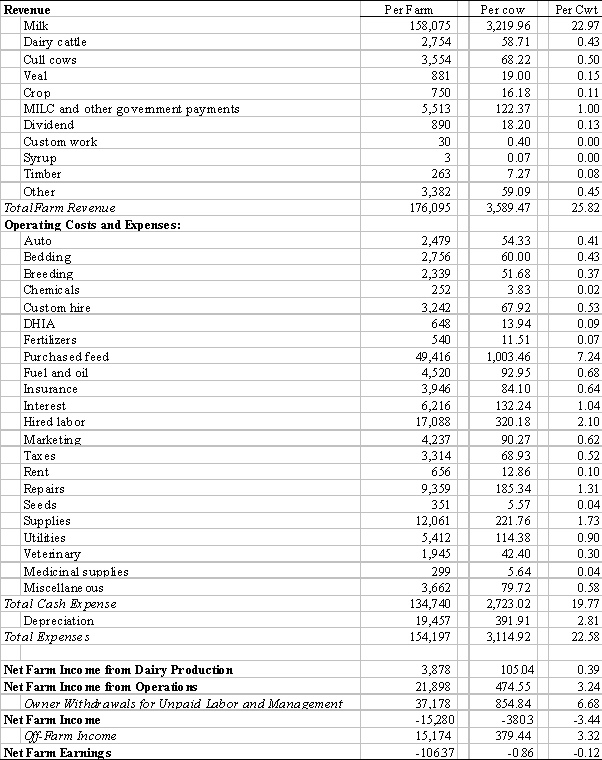
Note: Per cow and per cwt columns are average farm numbers and are not created by dividing the first column by the average herd size and production. N=30